
Astronomers plan to gain insight into the existence of the ‘mysterious’ dark matter by creating the first three-dimensional map of the universe, a project lead by UA astronomer Daniel Eisenstein.
The project, known as BOSS — Baryon Oscillation Spectroscopic Survey — is the chief component of the overall Sloan Digital Sky Survey III. Now in its third generation, the survey will build on past maps of the universe to formulate the biggest and best three-dimensional map yet.
“”We will take the original imaging from the SDSS and use better spectroscopy to push the boundaries of the map out further to map a larger volume of the universe,”” said Eisenstein, the director of the survey. “”It will have about seven times more volume than the previous survey.””
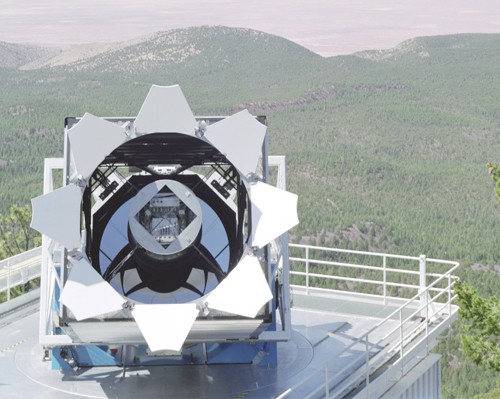
The team uses the 2.5 meter Sloan Foundation telescope located at Apache Point Observatory in New Mexico. Although the telescope is modest in size, the field of view is unlike any other, covering about 36 times the area of the full moon.
BOSS will survey baryon oscillation, which is the distribution of galaxies throughout the universe, through a relatively new and extremely sensitive optical-infrared spectrograph located on the telescope.
In the early history of the universe, the immense heat caused protons and neutrons, also known as “”baryons,”” to combine with light from the Big Bang to form oscillations — similar to sound waves.
Eisenstein explained it’s like throwing a rock into a pond. The ripples that move outwards are like the baryonic oscillations in the universe.
Four hundred thousand years down the road, it was finally cool enough to stop the spread of the waves — and what is left serves as a measuring stick for how much the early universe has expanded.
“”For instance, if we listened to a thunderstorm and a lightning strike, we know by counting the seconds until we hear the thunder how far away that storm is,”” he said.
The team confirms that measuring the baryon oscillations will ultimately help determine how dark energy affected the expansion of the early universe.
The process of the survey starts with pointing the telescope at a specific point in the sky and placing an aluminum plate, resembling a flying saucer, on the focal point. The light then comes off the primary light source, up to the secondary mirror and then back down to make an image.
The plate collects that image and a member of the team drills a small hole in the exact place where an object was spotted, then inserts an optical fiber into the hole. Team officials explained each aluminum sheet is drilled and designed for a specific part of the sky, and the survey team will use more than 3,000 plates throughout the survey.
“”The holes are extremely precise and the fibers we use have the diameter of a 10th the diameter of a human strand of hair,”” explained Eisenstein.
The light will then come down the fiber and go to the spectrograph in a very ordered location. The spectrograph is a box about the size of a large table.
From the map, astronomers can actually see clusters of galaxies and infer where dark matter is present. Scientists have confirmed dark matter tends to follow where galaxies are.
“”The universe is very lumpy and galaxies are positive tracers of dark matter,”” said Eisenstein. “”When we see clustering on our map, it is safe to say that the clustering is due to dark matter that gets imprinted into the early universe.””
The survey is still in the very beginning stages, but the team said enough data will be gathered in the next couple of weeks to start in on the science projects. But for the project to gather enough data to actually see the acoustic oscillations will take about a year.
The survey officials say the remarkable thing about the project is that it is able to survey many objects at one time; when they take one spectrum, they are actually taking thousands of spectra simultaneously.
It will continue taking data for the next five years and put out data releases every step of the way. In fact, most of the images from GoogleSky are provided from the survey project.
“”We aren’t the first map of the sky, but we are the best map,”” Eisenstein said.