
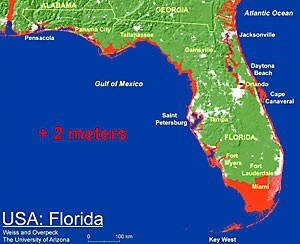
UA researchers in the geosciences department’s Environmental Studies Laboratory have devised two maps to figure out where water from the world’s rising oceans will end up.
The Dynamic Map Application is meant to show which coastal areas will be most affected by disparate increases in sea level from global warming. It was created by Jeremy Weiss, a senior research specialist with the project, and Jonathan Overpeck, director of the UA Institute for the Study of Planet Earth.
Two different data sets were used to create the Application’s maps – one for a global outlook and the other for a more detailed look at the contiguous United States, Puerto Rico and the U.S. Virgin Islands.
Using a complex algorithm with data from the United States Geological Survey, the maps show where water levels will rise based on their elevation and connection to the oceans.
The project will “”bring to light which areas are going to be potentially affected,”” Weiss said.
Though there isn’t a temporal component to the maps, Weiss said that a one-meter rise in sea level “” is certainly plausible by the end of the century”” and would drastically impact many of the world’s islands and coastlines.
Recently, the ice in the Arctic Ocean has melted enough to open the Northwest Passage, a sea route from the Atlantic Ocean to the Pacific Ocean that runs along the northern border of North America.
Another goal of the project is to “”start to get these concepts, which can be very abstract, into the public mind,”” Weiss said.
He said thousands of people have used the map, and that he and Overpeck have received more than 100 formal requests to use it for documentaries and scientific papers.
“”There’s been tremendous exposure with this work, which we weren’t expecting,”” he said.
Weiss is quick to admit that the maps are not perfect.
“”They’re not going to show exactly where the water will go,”” he said.
They also don’t take into account defenses against oceanic flooding, such as dikes and levies, or erosion that will occur as water rubs away at coasts, he added.
Weiss sees the map’s evolution so far as only a first step.He expects more people will join the project, allowing the team to improve on the data it has, and to incorporate other factors, like large storms, into the map’s models.
With finer resolution, it “”might be possible to look at large cities or at the county level,”” Weiss said.
He said the long-term use of these programs will help in the development of countermeasures against rising ocean levels around the world.
“”Arizona will be quite safe”” from the rise in sea level, Weiss said, adding, however, that the state will face other problems, like drought, from global warming.