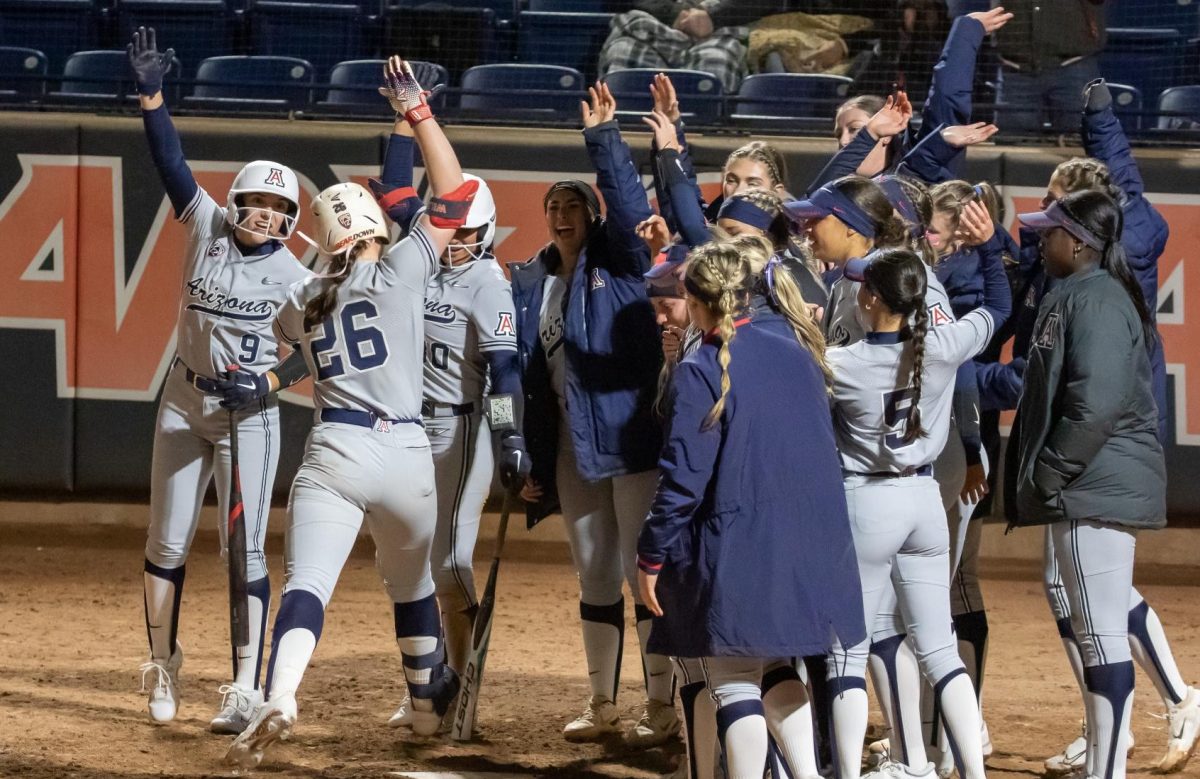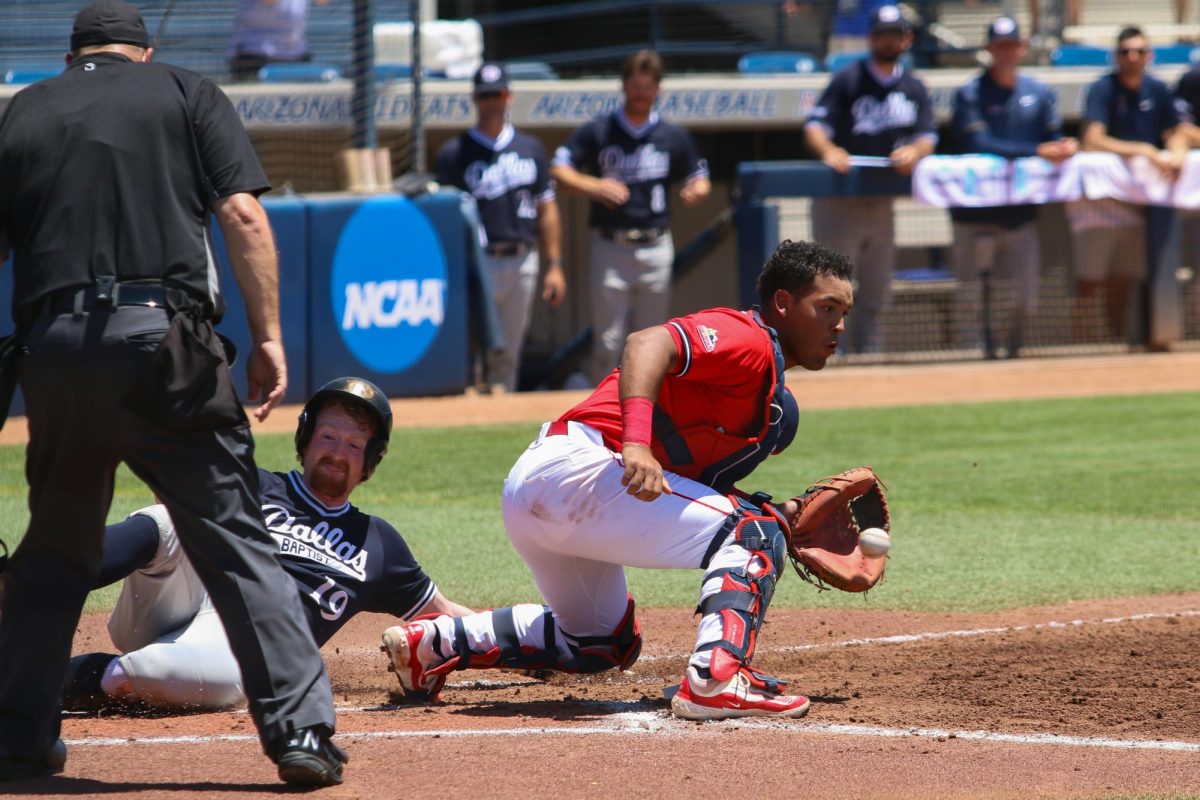


The Arizona baseball team could not keep the magic alive as they fell to Stanford in the elimination game of the College World Series, ending its 2021 season with a 45-18 record. Let’s take a look at three key stats that decided the game.
Hits
Arizona: 7
Stanford: 20
Arizona had a rough time trying to hit Stanford’s pitching. The Wildcats never got the big inning where they could string together hits that fans have been accustomed to seeing all year. For Stanford, they were able to open the flood gates early with a seven-run third inning. Stanford had 20 hits in this game and seemed to constantly have Arizona pitching on the ropes. Stanford had seven extra-base hits, so not only was Stanford hitting the ball, it was hard contact.
Pitching Comparison
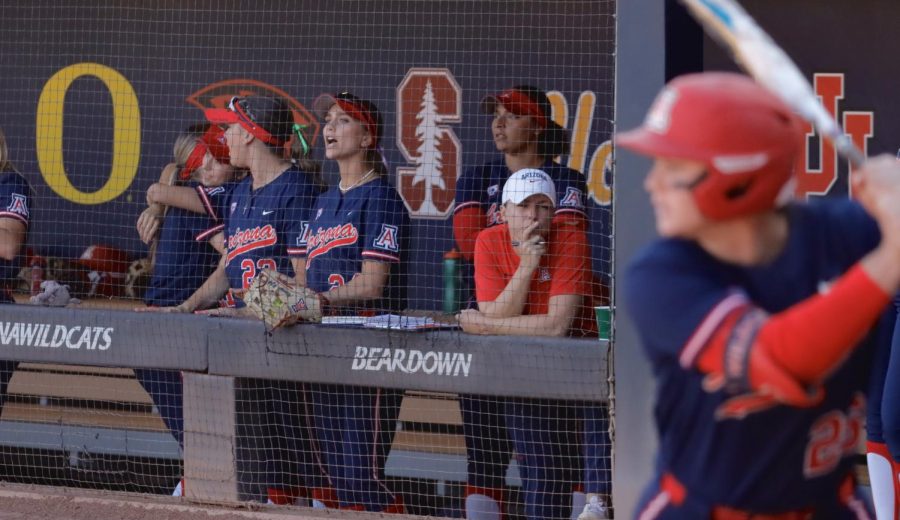
Arizona pitching never really had it. Starter Garrett Irvin was not sharp, only going 2.1 and allowing five earned runs. Arizona’s offense never really even got the opportunity to get back into the game since the pitching was getting rocked. Meanwhile, Stanford starter Alex Williams was able to go 5.1 innings, only giving up four earned runs.
Stanford reliever Jacob Palisch was lights out the rest of the way only giving up one earned. Arizona head coach Jay Johnson never was able to get consistency on the mound and this was a big reason for why they are heading home.
Runners in Scoring Position
Arizona: 3-8 (.375)
Stanford 7-18 (.389)
Stanford had 18 RISP compared to only eight for Arizona. Stanford had so many more opportunities to drive in runners and was able to capitalize on it. Arizona was not bad with RISP; their issue was they only had eight. It just proves how Arizona had an incredibly hard time hitting Stanford pitching and when they did it wasn’t hard contact.
Follow Seth Litwin on Twitter