
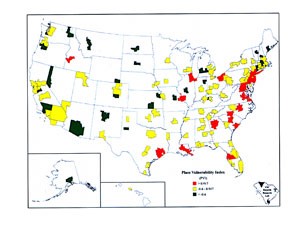
A UA researcher has developed a map of the 132 largest U.S. cities and assigned colors to each based on their vulnerability to terrorism.
The project, developed in part by Walter W. Piegorsch, a mathematics professor in the College of Science, started more than four years ago and was funded by the U.S. Department of Homeland Security.
“”We looked at a very large database – lots of different factors that could lead to a city’s vulnerability to any kind of natural or manmade disasters,”” Piegorsch said.
Piegorsch, Susan L. Cutter of the University of South Carolina and Frank Hardisty of Pennsylvania State University researched and created the map under a multimillion-dollar grant designed to study not only how terrorism occurs, but also how cities respond to it.
“”The punch line was that we found there was a link between the community’s experiences with, and their cognizance of, the threat,”” Piegorsch said. “”This is not about the probability of a terrorist event. This is more about a city’s experiences with disaster or terror, natural or artificial, and their ability to cope.””
They looked at 35 years of data, from 1970 to 2004, related to disasters and hazardous events including terrorism, distilling it down to a single vulnerability index.
The index was derived used from statistical methods used in research that involved identifying cancer-causing carcinogens, Piegorsch said.
“”We think it’s kind of innovative because it’s stuff that has been done for years in one area completely translated over into something no one ever thought about using,”” he said.
The cities’ vulnerabilities are assigned using three color groups: green (low), yellow (medium) and red (high).
Researchers found a swoop of red cities from Houston up to New York, and green cities starting in New England and heading southwest.
While he wasn’t expecting a pattern, he realized the colors broke down like that because red cities tend to be older and more population- and building-dense, with limited points of exits, like the bridges to Manhattan Island.
Spread-out cities like Tucson and Phoenix, which are both green, are a lot more open, with easier road access out of the cities, he said.
“”The one thing that sticks out is poor Boise, Idaho,”” Piegorsch said about the highly vulnerable city. “”Everything around Boise is green or yellow.””
Boise’s red designation was due to some disastrous floods and fires the city had suffered during the 35 years the data applied to, he said.
Over the last few weeks, Piergorsch said he has talked to representatives from Boise, the FBI, the U.S. National Guard and emergency management teams in various other cities about the map.
Response has been good, and he hopes for coordinated emergency management in many cities.
“”Our goal is to get cities to think about it,”” he said.
Despite its favorable coloring, Tucson should always be assessing its risks, he said.
The researchers will continue to study and update their data as communities respond to their evaluations, he said.
“”This is just a piece of the puzzle,”” he said. “”We have more research we want to do, and we’re doing it.””