There are a variety of reasons a student may leave a university. They may transfer to a community college, have financial and family issues, be taking a gap year or be dropping out completely.
For the past few years, the University of Arizona Eller College of Management’s INSITE Center for Business Intelligence and Analytics has taken on a project researching these reasons and how to identify students who would drop out — and the primary data points have come from students’ CatCard activity.
For public universities, retention is important for using financial resources effectively and for maintaining a university’s reputation.
According to US News, the average freshman retention rate at public universities between 2012 and 2015 was 78 percent.
Sudha Ram, director of the INSITE Center, said that INSITE’s mission is to develop machine learning algorithms and work with large data sets to develop methods from connections between things, people, objects and information.
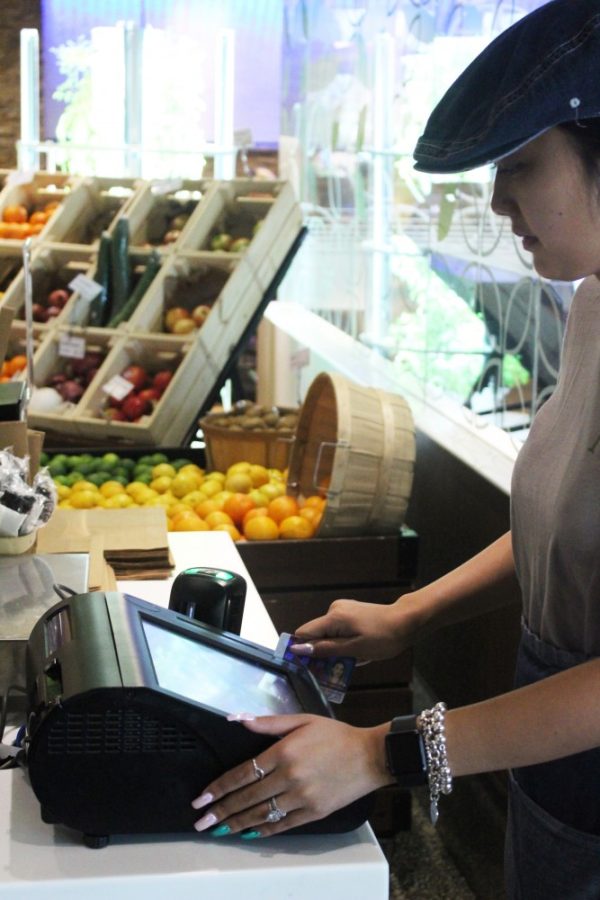
When a student’s CatCard is swiped, a timestamp and location is recorded and put on a secure server for INSITE to access. However, these are anonymized by the UA Office of Student Retention and Academic Success, OSRAS, for privacy purposes.
“Student retention is something that’s been studied in the literature,” Ram said. “There’s a lot of papers being published on this topic. It’s been tackled for the last 40 to 50 years — it’s not a new problem.”
RELATED: Work is a battlefield: new study reveals high rates of female-on-female workplace incivility
The INSITE researchers look at these records of CatCard swipes to find each student’s social interaction patterns and if they’ve established a regular routine on campus.
According to Ram’s research, the reason students drop out is from not establishing good social interactions or a regular routine. She also found that when students do decide to drop out, it’s within eight to twelve weeks of the first day of class.
“We have numbers that say the strength of interactions in the time period, number of individuals they’ve interacted with, the rate at which it is growing or decreasing [are factors],” Ram said. “There’s a flag to indicate whether they’ve had a regular routine or not. We put the data together through some suggested demographics, like are they in-state or out-of-state students and basic categories like age groups.”
In the dataset server, a flag is assigned to every student if they dropped out.
“INSITE’s algorithm learns from the input variables,” Ram said. “The team gives an order to label it ‘yes’ or ‘no’ if the student is likely to drop out. When the machine algorithm spits out results, it can say, ‘I predicted that 200 people will drop out. The data said 300 people actually dropped out,’ so we ask how many was I able to predict correctly. That’s where we get the 80-90 percent success rate in predictions.”
RELATED: Q&A with Paloma Beamer: President of International Society of Exposure Science
Machine and human bias is another reason why the predictions can’t be completely successful.
“There’s always bias, it’s up to human interpretation. You have to decide whether the algorithm is telling you the right things or not,” said Ram.
If social interaction and campus regularity is not considered, then the predictions are only about 60 percent correct, so social interaction measures from the trajectories of CatCard information is actually useful.
INSITE’s project had to go through a verifying process with the Human Subject Protection Program of the Institutional Review Boards.
“We don’t contact any students, we don’t experiment with them, we still have to get approval from them and the university. Then they had to figure out how to anonymize the data so we could glean interactions,” Ram said.
After that, it’s up to the student retention office to determine at-risk students and consider possible intervention strategies.


