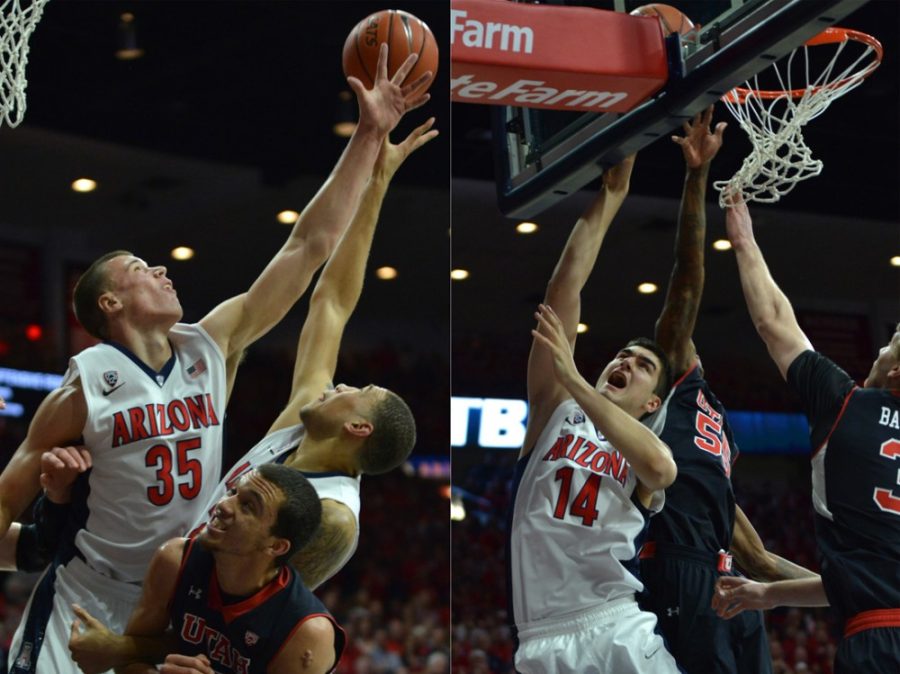
At the beginning of the season, no one would have given the following question any thought: Should Dusan Ristic start over Kaleb Tarczewski? The answer is still probably “no.”
However, 20 games into the season, Tarczewski’s erratic play — especially offensively — has forced the question into a more prominent light. Pure per game stats show Tarczewski is averaging 8.7 PPG and 4.9 RPG, and Ristic is at 3.4 PPG and 2.2 RPG. After coming from Serbia just a few years ago, Ristic is still learning the American game, while Tarczewski has been average this season for the Arizona Wildcats.
However, should Tarczewski see his minutes decreased and Ristic see his minutes increased? The answer is definitely “yes.”
Much like baseball, it’s tough to truly gauge a player’s importance or worth to a team without implementing advanced statistics. Unlike baseball, there are far fewer advanced stats in basketball.
In this scenario, the advanced stats back up the claim that Ristic should be seeing more game action. For starters, let’s dive into per 40 minute averages, which is what a player would average over 40 minutes of action. Tarczewski has per 40 minute averages of 13.0 points, 7.4 rebounds, 0.9 blocks, 4.7 fouls and a .582 field goal percentage, and Ristic is at 15.1 points, 9.7 rebounds, 1.1 blocks, 6.3 fouls and a .571 field goal percentage.
The per 40 minute stats favor Ristic’s ability to score and rebound in his time on the court, while Tarczewski shoots a field-goal percentage just a bit higher than Ristic’s. The foul number is the biggest difference between the two 7-footers. Tarczewski’s 4.7 fouls per 40 minutes is not good, but Ristic’s 6.3 fouls per 40 minutes is much worse.
Ristic is obviously still learning the intricacies of the collegiate game, so he gets a pass right now in that regard. Come next season, that many fouls will not be tolerated.
Next up are more complicated rebounding stats such as offensive rebounding percentage, defensive rebounding percentage and total rebounding percentage. Each estimates the percent of available offensive, defensive and total rebounds that a player hauls in during his on-court action. Tarczewski has an ORB percentage of 6.9, DRB percentage of 15.9 and TRB percentage of 11.5, while Ristic has an ORB percentage of 8.9, DRB percentage 21.1 and TRB percentage of 15.2.
Based on how sporadic Tarczewski’s rebounding has been lately, it’s not surprising to see Ristic come out on top of this metric. Most people who have regularly watched the Wildcats this year could tell you he was a more efficient rebounder based on the eye test.
What the advanced stats really show is how troublesome this season has been for Tarczewski, as the 7-footer has seen his ORB, DRB and TRB percentages drop every year since his freshman season. For someone who is so important to the team, that’s not a good sign.
Up next are turnover percentage and usage percentage. Turnover percentage estimates a player’s turnovers for every 100 possessions, while usage percentage estimates the percent of team plays a player uses while on the court. Tarczewski has a TOV percentage of 19.3 and a USG percentage of 17.3, while Ristic has a TOV percentage of 7.8 and a USG percentage of 19.1.
Based on those numbers, Ristic is more involved and efficient within the offense. The usage percentage can be chalked up to Ristic playing with reserves and Tarczewski playing primarily with starters who control the ball more than he does. The turnover percentage is troubling, though. For Tarczewski to have a TOV percentage higher than his USG percentage signifies that when he does get the ball, he doesn’t make productive plays with a good chunk of his touches.
In today’s game where efficiency is highly valued, it’s tough to keep a guy like Tarczewski in for late game situations when he’s statistically more likely to turn over the ball than any other big man on the roster.
Bringing up the rear of this advanced stats parade are offensive rating and defensive rating. Offensive rating is an estimate of points produced by a player per 100 possessions and defensive rating is an estimate of points allowed per 100 possessions. Tarczewski has an ORtg of 107.7 and a DRtg of 91.0, and Ristic has an ORtg of 113.8 and a DRtg of 91.6.
Looking at those stats, the trend of Ristic being better offensively than Tarczewski continues to show. On average, Ristic produces 6.1 more points per 100 possessions than Tarczewski. The biggest shocker throughout all of this is the nearly identical defensive rating. This is certainly not the case from the eye test, as Tarczewski is often praised for his superior defense compared to Ristic. Admittedly, I was once among those that favored Tarczewski defensively. Now, not so much.
It’s irresponsible to disregard advanced stats when considering Ristic vs. Tarczewski. Pure eye tests are necessary in sports, but these advanced stats often show another side of players that can’t be seen just by watching basketball. In this case, advanced stats point to how Ristic needs to see more playing time, and Tarczewski needs to see less.
It’s nothing personal. Just the stats.
_______________
Follow Roberto Payne on Twitter.


